Statistics and probability
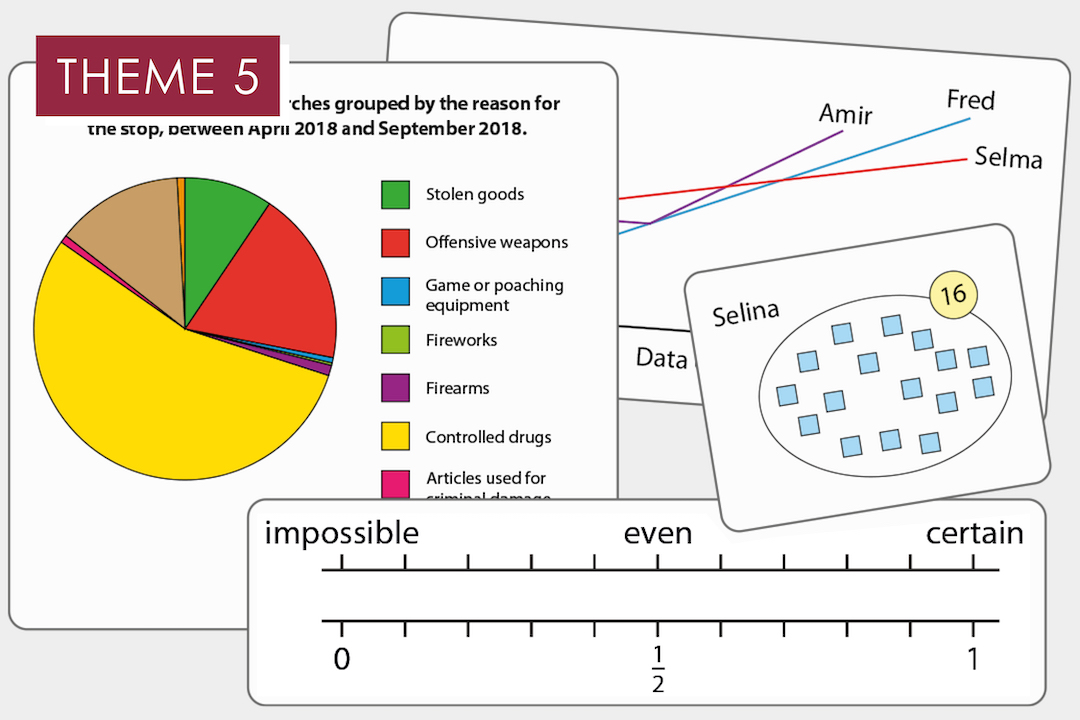
Theme 5 comprises three core concepts: statistical representations and measure; statistical analysis; probability.
The links immediately below take you to pages dedicated to each core concept, which include all the classroom and professional development resources you need.
Underneath the links to the core concept pages, you can download an overview of the entire theme, and a single download of all core concept documents within the theme.
-
5.1 Statistical representations and measures
Core concept 5.1 covers measures of central tendency, work with grouped data and measures of spread, as well as the construction of scatter graphs and pie charts.
-
5.2 Statistical analysis
Core concept 5.2 explores making informed choices about which statistical analysis and representation to use for different types of data, as well as the effect on interpretation.
-
5.3 Probability
Core concept 5.3 introduces probability as a way to quantify, explore and explain likelihood and coincidence, and to reason about uncertainty.
