Year 3 - Statistics
New Curriculum
- interpret and present data using bar charts, pictograms and tables
- solve one-step and two-step questions [for example, ‘How many more?’ and ‘How many fewer?’] using information presented in scaled bar charts and pictograms and tables.
Non-Statutory Guidance
Pupils understand and use simple scales (e.g. 2, 5, 10 units per cm) in pictograms and bar charts with increasing accuracy.
They continue to interpret data presented in many contexts.
Links and Resources
| Programme of study statements | Activities | |
|---|---|---|
| A | B | |
| interpret and present data using bar charts, pictograms and tables | ||
| solve one-step and two-step questions such as ‘How many more?’ and ‘How many fewer?’ using information presented in scaled bar charts and pictograms and tables | ||
Activity set A
You could carry out a human bar graph activity. Think of a scenario such as favourite sports. Give each child a Post-it note and ask them to draw them
playing their favourite sport onto it – no words, just pictures. Next ask them, in small groups, to stick the Post-it notes on the board to make a bar chart. As they do this, listen to what they say. Someone might wonder what one of the drawings is and this can lead into a discussion about the importance of labels. You could then ask some of the children to write labels for the different sports and add them to the board to form a horizontal axis. Once all the Post-it notes are on the board, discuss the scale size of the vertical axis. If you decide to go up in steps of two, double up the Post-it notes for all the sports and then ask some children to write the appropriate numbers and add these to the bar chart. When you have done that discuss why a title would be useful and add this. The children could then draw the bar chart on paper and write some statements about the information it shows.
You could display a pictogram similar to the one below. Ask the children to work out what the scenario for the pictogram could be and to tell you what it shows.
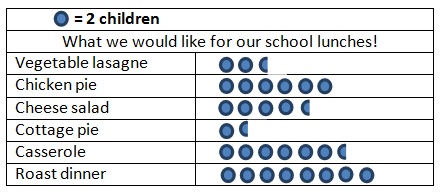
You could then give the children some plain paper and ask them to make a pictogram to show which of the food choices from the pictogram in the picture the class would make or they could do their own survey, make a tally and then a table before constructing their pictogram. They should consider how many children each symbol will represent.
You could ask the children to work with a partner and make a list of 6 pieces of information that the pictogram gives them. Encourage them to include statements that involve addition and subtraction, e.g. 3 more children prefer roast dinner than casserole, 58 children took part in the survey, 17 children voted for vegetable lasagne and chicken pie. They then share these with another pair and add any new statements the other pair made to their list.
You could show some of the existing data from the Data Handling ITP and ask the children to analyse them.
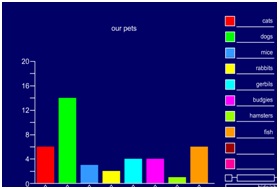
You could use this pet graph and ask the children to make up and answer questions from it. Encourage them to make up questions that involve addition and subtraction.
Activity set B
There are several activities on the Nrich website which ask the children to solve problems within the context of statistics. Why not try these with your children:
- Match the Matches could be used at the start of a series of lessons on data handling, or as an assessment opportunity at the end of the unit. It will get children talking meaningfully about mathematics, presenting and justifying arguments.
- It’s a Tie allows children to simulate a probability experiment, to be involved, be creative, and construct their own meanings and explanations for the results they come up with.
- More Carroll Diagrams gives children a way of sorting numbers according to different properties and also forces them to consider more than one aspect at once. It also provides opportunities for children to explain their placing of the numbers, using appropriate language.
- Venn Diagrams provides an opportunity for children to become familiar with Venn diagrams, whilst reinforcing knowledge of number properties. Placing numbers in a Venn diagram requires children think of more than one property of a number at the same time and this problem will encourage them to explain their reasons for placing the numbers.